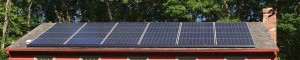
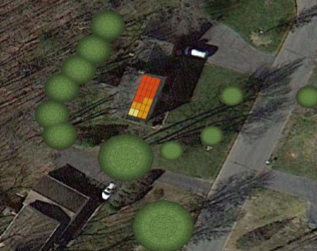
And there are 24 solar panels on my house soaking it all up!
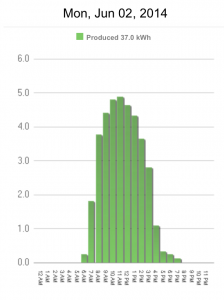
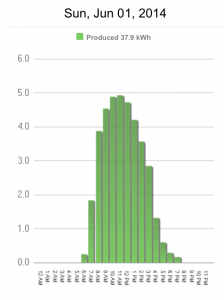
Yesterday the panels collected 37 kWh and the day before was 37.9 kWh. To give you some perspective, the average household in Connecticut uses 731 kWh a month or about 24.4 kWh a day. Of course this varies by season and so does the amount of sunlight available for capture, but regardless, a few 37 kWh days create some significant, emission free energy.
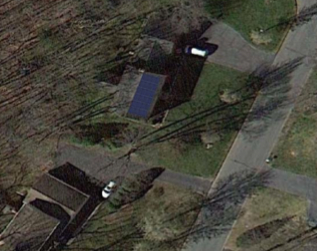
When the solar company first considered the house for panels, they did an estimate using a basic area measurement in Google Earth. They also gave the trees (which had no leaves in these images) a canopy to aid in the estimate. From there, they reported the estimated system size and the estimated production and determined it was worthwhile here – which is not always the case.
This little analysis is a taste of what a number of big cities have done for large areas. They have created some slick interactive maps with tools to estimate how much solar energy could be created on existing rooftops based on a number of criteria.
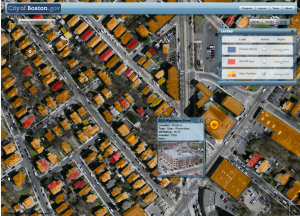
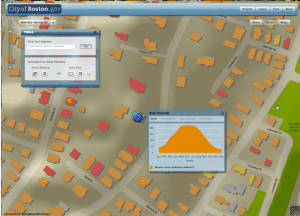
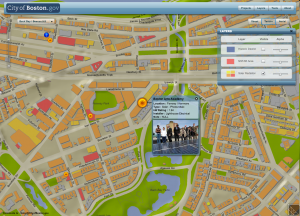
As far as I know, Solar Boston was one of the first and impressed many a map-maker. Zoom in all over the city to see solar radiation estimates, existing solar installations (sometimes with pictures), or select a building or area to see solar potential and calculations.
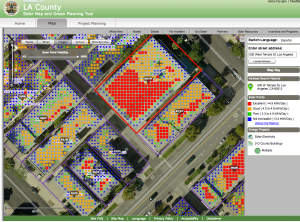
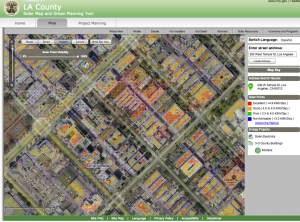
LA County has a map where they have placed dots on rooftops to indicate the suitability of that spot for solar energy. They used a combination of roof area suitable for solar, potential system size, potential annual output, potential cost saves and potential annual emissions savings to come up with the rating. I especially like that the model explanation mentions using high resolution imagery and elevation data (see past posts about imagery and elevation).
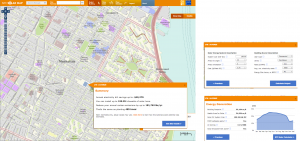
New York City has a nice solar map where you can select a building or area and get a summary report, energy generation details and even access to the solar calculator.
And if that’s not enough, this page from the American Planning Association lists a lot more places that have solar maps AND a lot more about solar maps in general.
Solar definitely has potential. And not only on roofs. There has been a lot of buzz about solar pavers. These cool panels can be put down when building a road or parking lot. As quoted from the Solar Roadways website, “the custom, glass-covered pavers are strong enough to drive on while generating enough power to light the road, melt ice and snow, and send extra energy to cities. Eventually, if every paved surface was covered in the product, the panels would produce more power than the nation uses.” How amazing is that? And to prove people agree, the crowdsourcing funding campaign has raised almost $2 million (at time of writing) with over 43,000 funders which is the most the website has ever seen.
People are seeing the potential in solar. The future is bright.
