Certified Forestry Surveyor? Calculated Fournier Series?
A recent conversation (most likely over a beer, but that doesn’t really factor in here…) with my neighbor provided fodder for this post. We were mapping out our route for opening day of fishing season, and I commented that the Fenton was running over 150 cfs, so it might be tough to fish it. He looked at me like I had three heads, and said “OK, I give up- what the hell is a cfs?” Now my neighbor is not in the environmental field, but he is one of the smartest people I know. So it occurred to me that it might not be a bad idea to make this blog post about the topic of water measurement.
“CFS” stands for cubic feet per second, a common English unit of river discharge (metric units would be cubic meters per second). It is a volume of water per time. The United States Geological Survey (USGS) provides publicly accessible real-time data on the discharge of thousands of rivers around the country. These measurements began in 1889 on the Rio Grande, to aid in agricultural irrigation. But how is river discharge calculated?
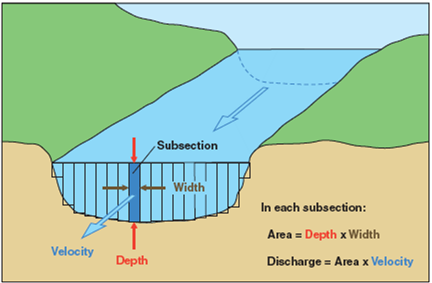
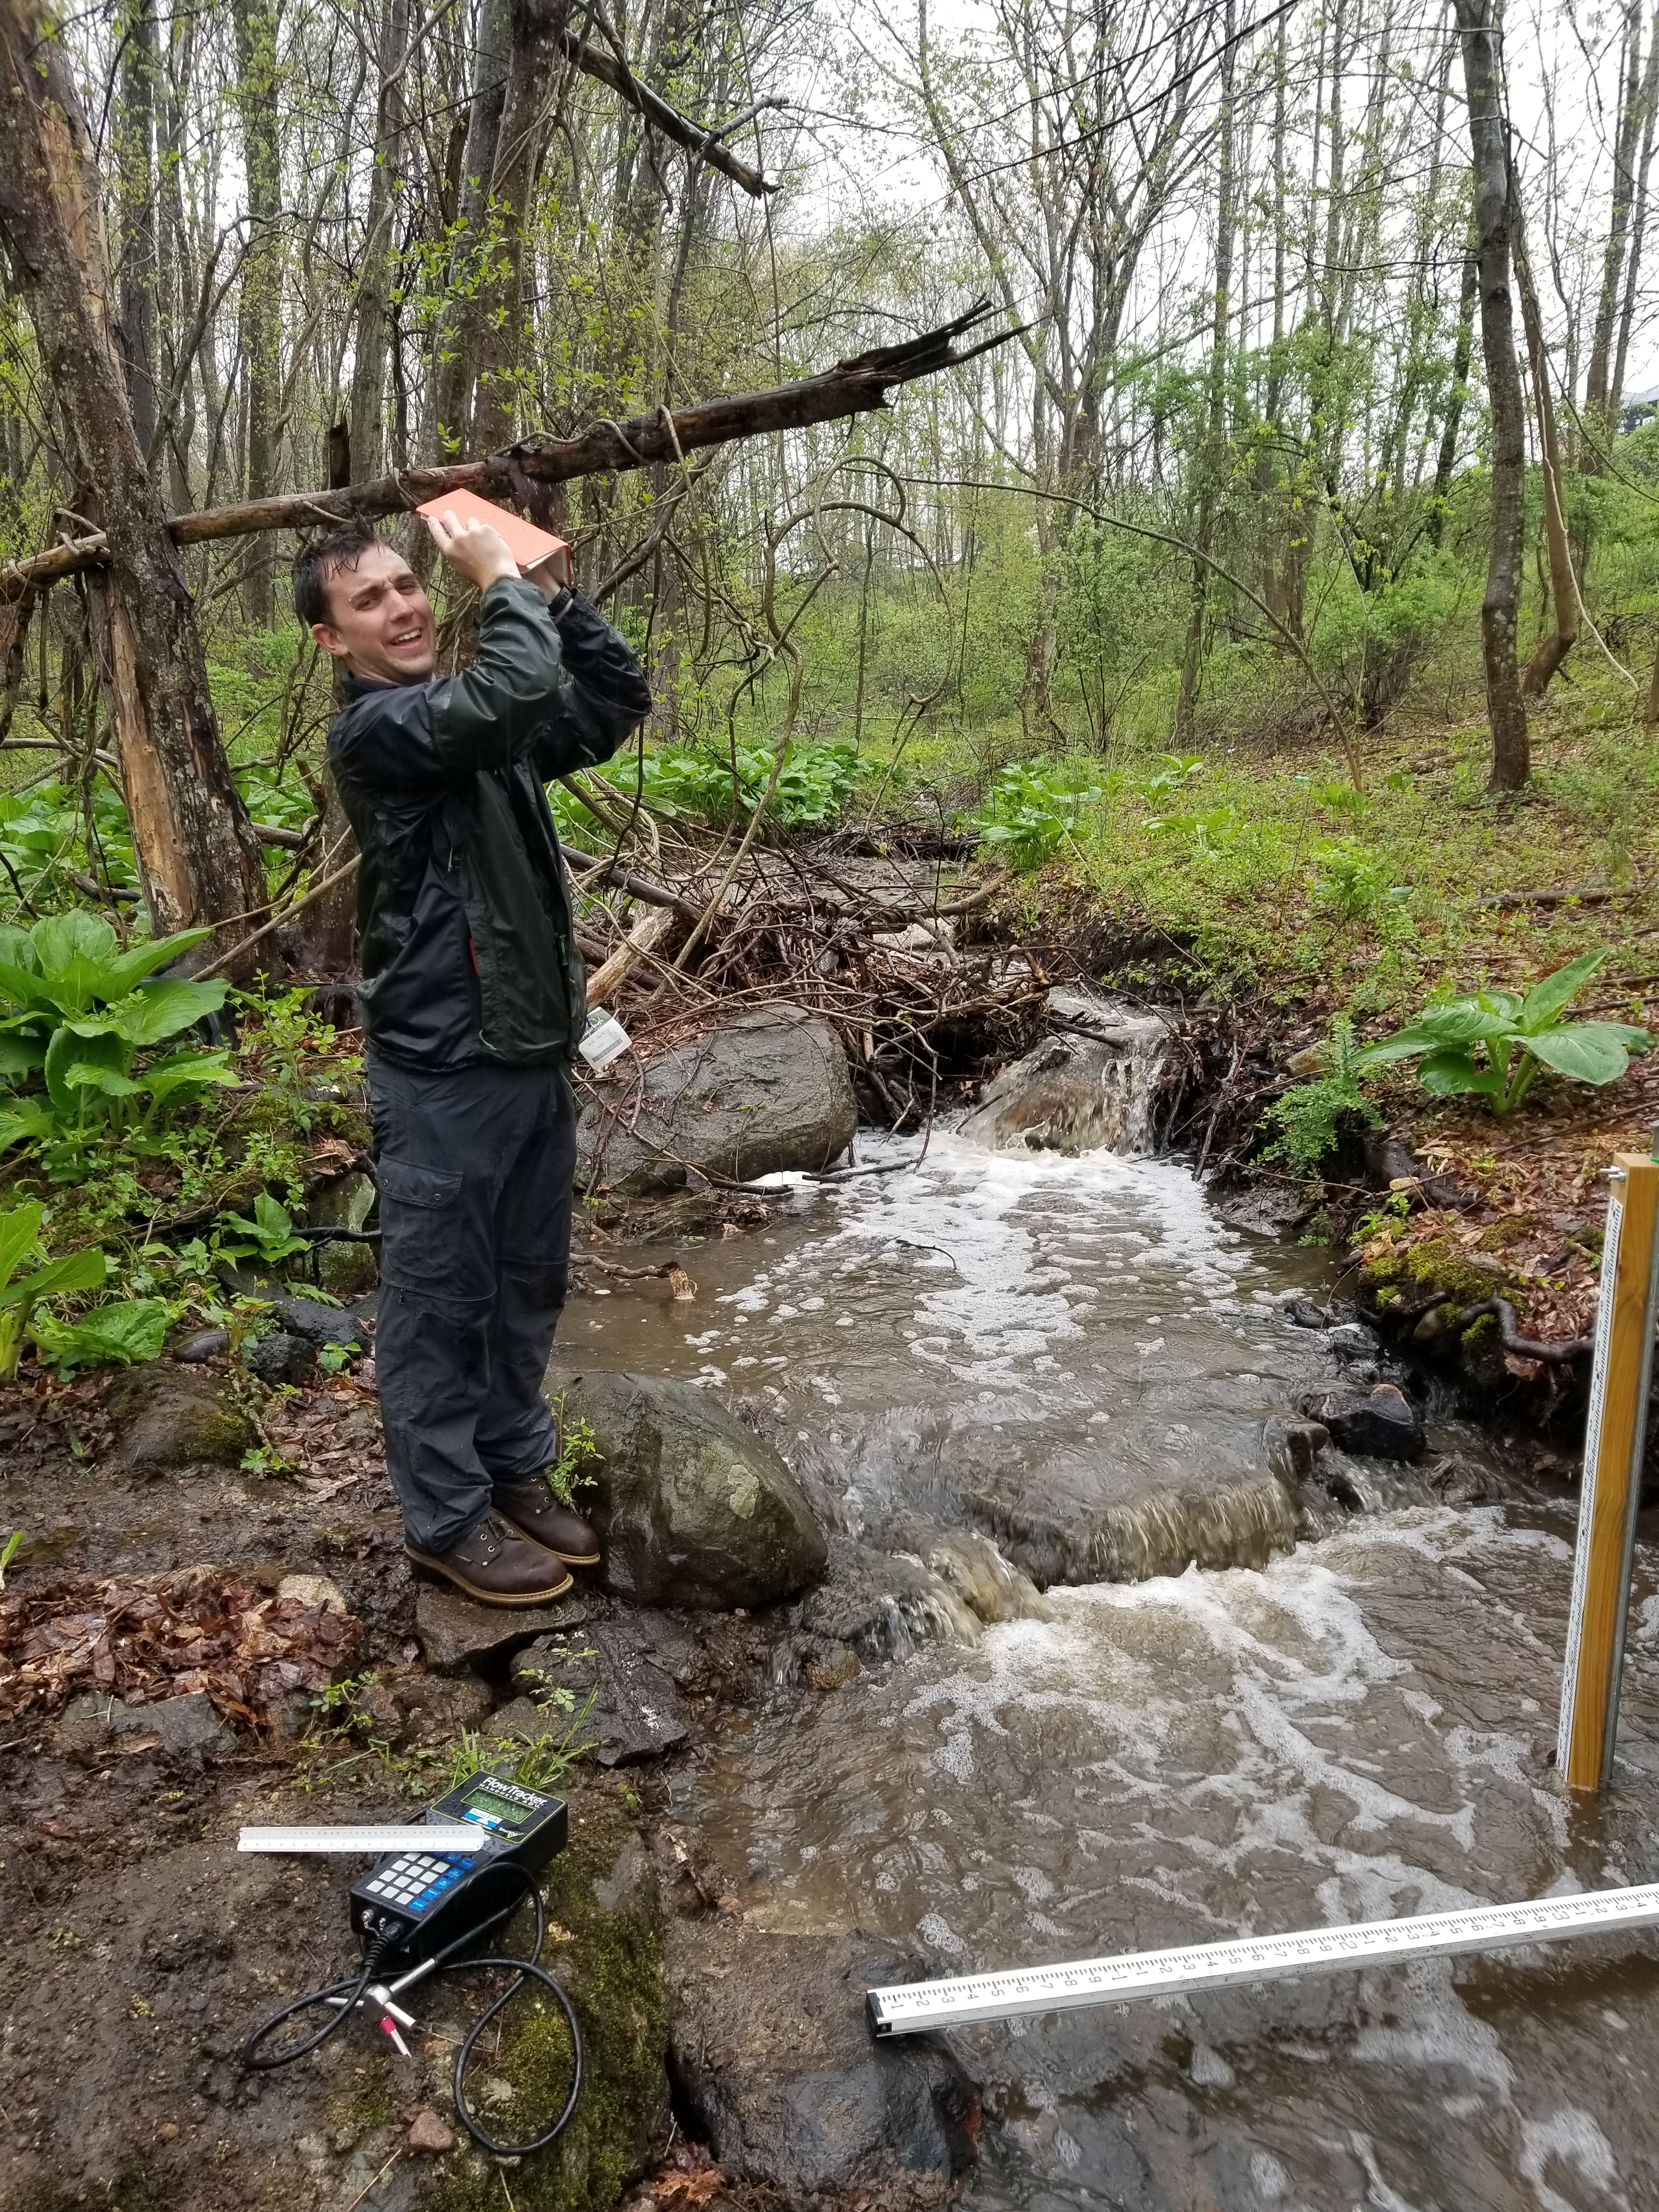
Several steps are needed to calculate discharge. A relationship between the depth of water in the river (stage) and the river discharge needs to be developed. To build this relationship, a number of discharge measurements need to be taken at different river stages. To make an individual discharge measurement, the cross-sectional area (in square feet) of the stream is multiplied by the velocity of the water (in feet per second), to give cubic feet per second (cfs). Velocity was historically measured with mechanical devices, but now there are sophisticated electronic meters that can be used (although in a pinch, simply floating an object like an orange down the segment and timing how fast it moves can provide reasonably accurate measurements). The way this is done in the field is to break up a cross section of the river into a number of individual segments, and measure the area and velocity in each, then sum them together (Figures 2, 3).
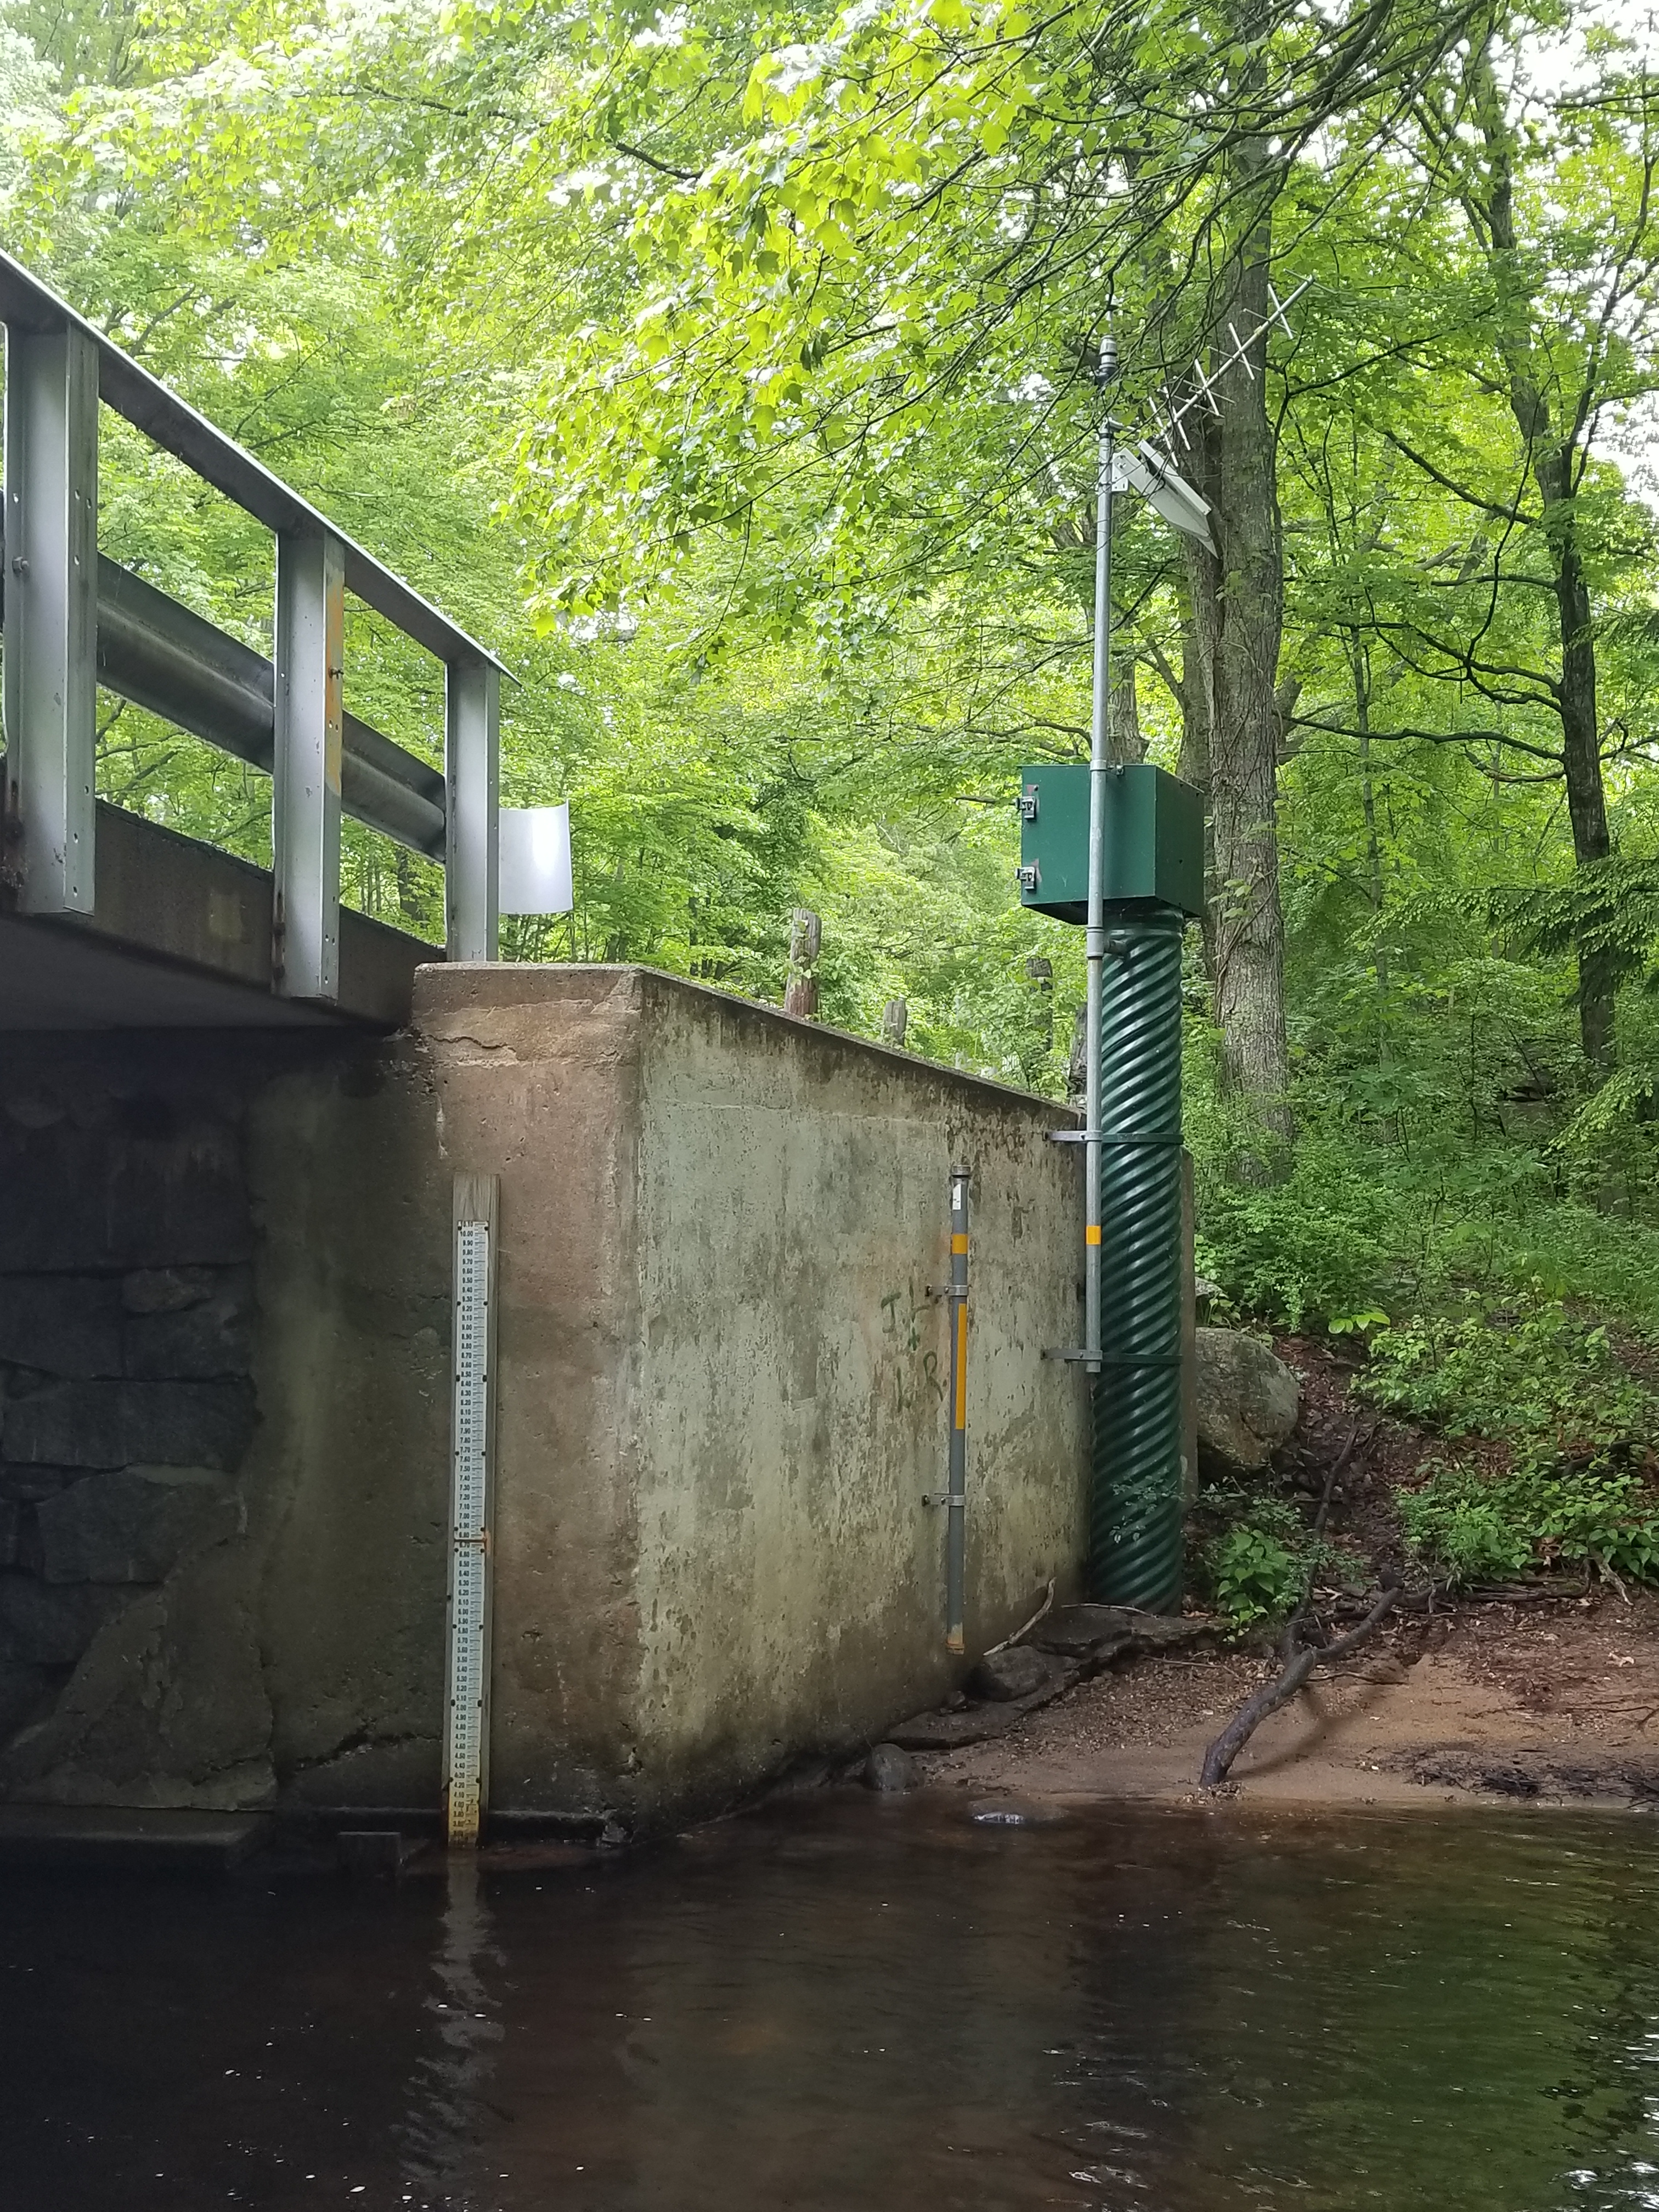
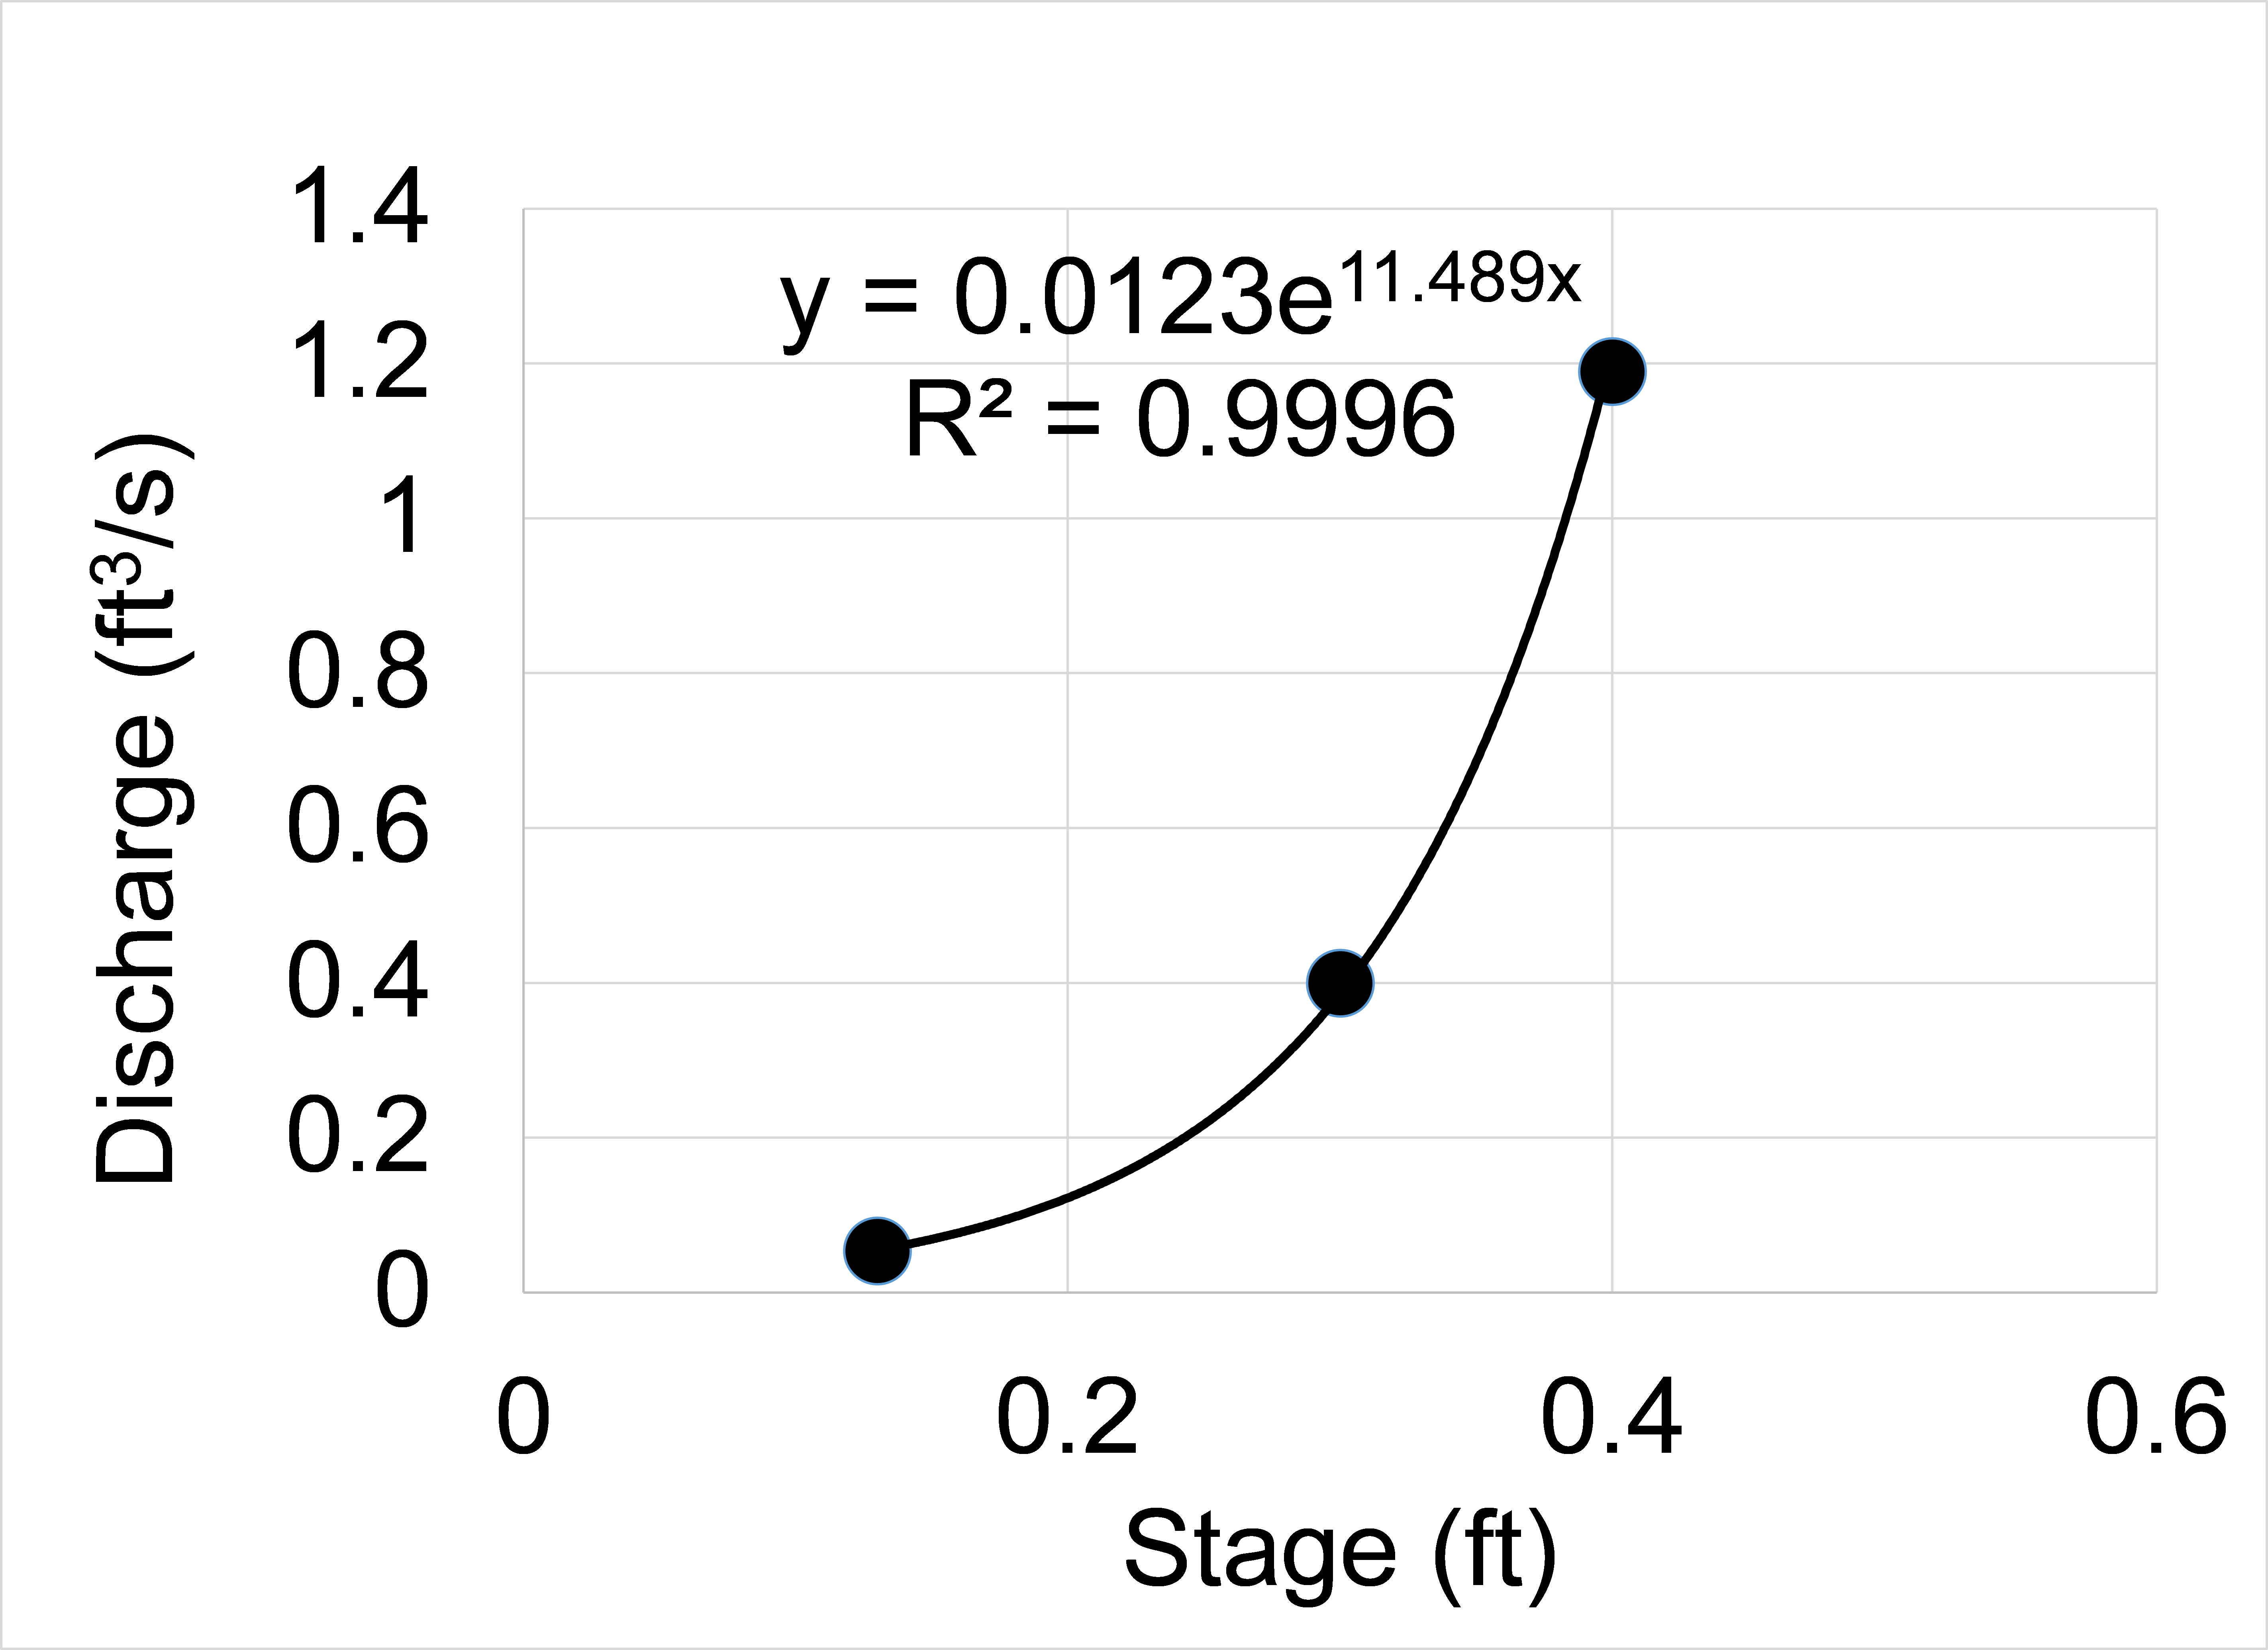
This value is then related to the stage, or depth of water measured on a fixed staff gage. You may have seen a setup like this at one of the USGS monitoring stations on a river near you (Figure 4). USGS continually measures the stage of the water on a measurement device-historically these were mechanical recorders, but now they are mostly connected to an electronic device that measures the depth of water in the river. Once a suitable number of measurements are obtained for a wide range of river stages, an equation is fitted to the line (Figure 5). This the allows the computation of discharge from the continuously measured river stage values.
For this Eagleville Brook rating, at this point we can only predict discharge for stage values in the range shown on the graph. Over time, we will add more values at higher stages to further calibrate the equation. This will increase the overall accuracy of the predictions, although there is always some error associated with any scientific measurement.
So after then next big rain, you can now impress your neighbors when you tell them how many at how many cfs the river near you is running!
Resources: USGS Streamflow Measurement.