The Rain Garden App 


In case you haven’t heard, a couple of years ago, NEMO (David Dickson and Mike Dietz) created a cool smartphone app that is all about building rain gardens. It is full of background information including what a rain garden is, how it works, pictures of existing rain gardens and even videos about how to dig the garden, select plants, size it correctly, maintain it and more. It was originally created for Connecticut, but efforts are underway to expand it to more states. This means area-appropriate plant lists and soils drainage information. Ah, soils drainage class – what this blog is all about. Soil drainage is important because, well, the purpose of a rain garden is to absorb water that runs off from roofs or pavements or other impervious things. And if the soil can’t absorb water, it’s not a good place for a rain garden. It was no small task to create the interactive, quick and accessible drainage class map for 25 states¹. It took a lot of time, sweat, googling and frustrated fist-pounding to get it to work properly. Just in case you ever have to do something like this, or for some strange reason would just like to know how it can be done, below is the process, in a nutshell.
Soils Data
The first step was to download the gSSURGO data from USDA NRCS Geospatial Data Gateway (order by state). After downloading, unzipping and unzipping again, the data is a geodatabase that contains several base geometry files (points, lines or polygons that can actually draw on a map), close to 70 data tables that can be attached to those geometry files for mapping, and 60 or so relationship classes which I won’t get into here. I needed the polygons of the soils (MUPOLYGON) and an attribute² in a table in order to color the polygons by drainage class. At first, I started using the component table which has an attribute called drainage class which”identifies the natural drainage conditions of the soil and refers to the frequency and duration of wet periods.” Although this sounded right, I discovered that one soil polygon can have many different drainage classes which makes it quite difficult to map. The better table turned out to be the mapunit aggregated attribute table which has an attribute called drainage class dominant condition described as “the natural drainage condition of the soil refers to the frequency and duration of wet periods. This column displays the dominant drainage class for the map unit, based on composition percentage of each map unit component.” Just what I needed.
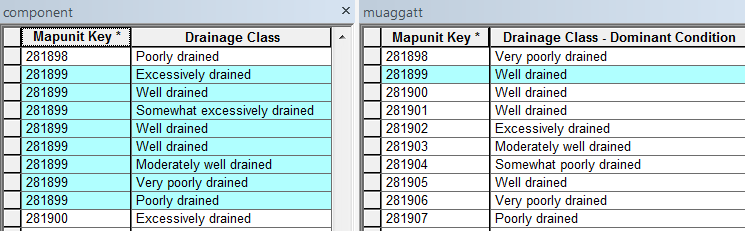
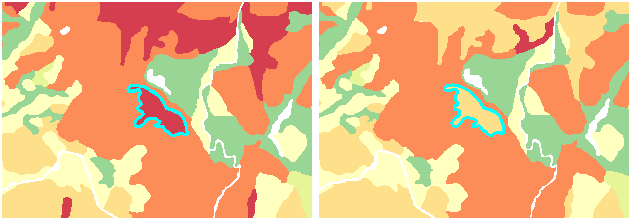 Comparison of the two different drainage class attributes. The component table and drainage class (drainagecl) map is on the left and the map unit aggregated attribute table (muaggatt) and dominant drainage class (drclassdcd) is on the right. Notice how multiple drainage class records exist for polygon 281899 in the left example and only one record on the right.
GIS Steps and Resulting Model
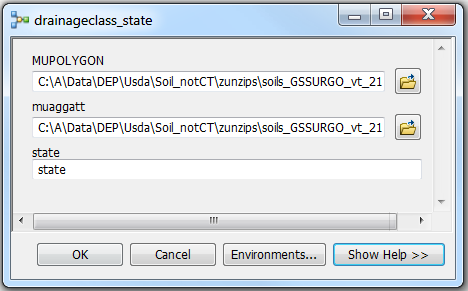
The same geoprocessing steps needed to be repeated for each state: download data, join the map unit aggregate table to the map unit polygon layer using the mapunit key attribute, dissolve³ based on drainage class values, reproject to the web mercator (auxillary sphere) coordinate system and save. Repetitive steps like these are perfect for a model that can be run repeatedly. I created the model in modelbuilder (ArcGIS) and it cranked through the states. Sidenote – CLEAR’s geospatial training program offers a modelbuilder class from time to time. Let us know if you are interested. 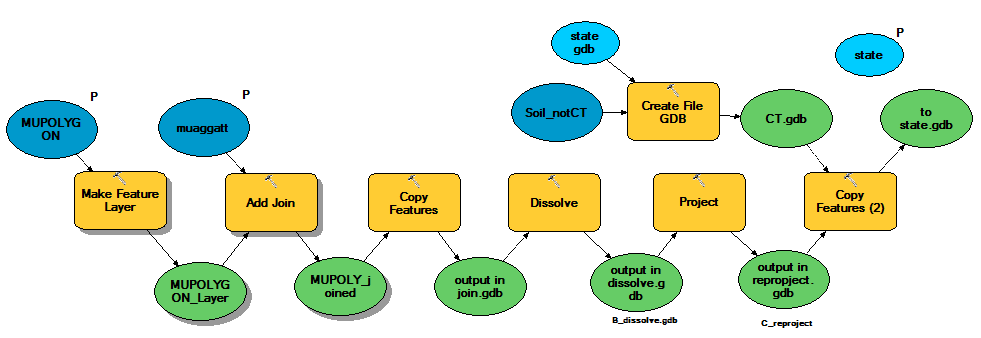
Interactive Map Service
After all the states were processed, the model outputs were copied to a development server to create the map service and cache. A map cache is a series of small tiles that cover the map extent at several scales so that when the map is accessed, the tiles are retrieved much faster than actually drawing the map itself. The cache was critical for this service as the soils files are large, especially over an extent like all of the US including Hawaii! 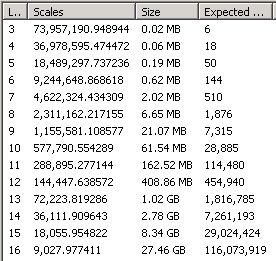 After some trials and a hefty dose of errors, 10 scales were successfully cached covering the full map extent. The cache consists of 154,784,545 tiles using over 40Gb of disk space that took over 80 hours of computer-crunching time to create. After another round of trials and a hefty dose of problems, the geodatabases for 25 states, the map document and the completed map cache were copied to the production server and the map service was started. You can experience the map service outside of the map by going here. Yes, this page is for techy types, but click on any of the View In: options to see the map in your web browser or using Google Earth (skip ArcMap unless you have the software on your computer) .
Soils Map in the App
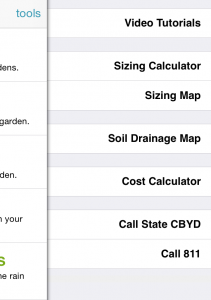
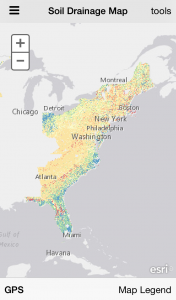
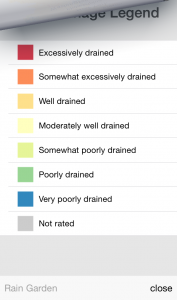
There are a few different ways to get to the map in the app. One way is to click on tools in the upper right corner of the home page and then find Soil Drainage Map. Once there, zoom around and explore. It is amazing that so much data can be accessed so quickly on that little screen in the palm of a hand. At least I think so.
¹ The 25 states currently in the map are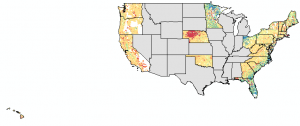
² An attribute is nonspatial information about a geographic feature usually stored in a table.
³ Dissolve is a geoprocessing command that removes boundaries between adjacent polygons that have the same value for a specified attribute, here soil drainage class. The result is a simplification of the data and a decrease in the number of polygons.