This week CLEAR unveiled the updated and expanded version of our Changing Landscape (CL) project, which uses remote sensing imagery to look at changes in our landscape over time. Formerly called “Connecticut’s Changing Landscape,” the project now includes the NY portions of the lower Long Island Sound watershed, and boasts a whopping (not to mention nationally unprecedented) 25 years of change, from 1985-2010. See last post for more information.
Changing Landscape data is in 30 meter pixels (short for “picture elements” for you jargon derivation fans out there) — squares roughly 100 feet on a side that tell us the predominant land cover within that square. In this world of GoogleMaps, GoogleEarth and Bing, where high resolution imagery is at our fingertips 24/7, is 30m data really still relevant and useful?
In a word, YES. First of all, land cover data and imagery are not the same thing. We use land cover data for these reasons:
- Because it enables us to look at large areas over long time periods.
- Because we can quantify it, and thus say something meaningful about change (quantifying high resolution imagery is still an evolving and expensive prospect).
- Because it’s a dataset that tells us something quite unique — there is a growing body of literature that links land cover parameters like impervious cover, forest cover, and riparian area (streamside) cover to watershed and ecosystem health.
We developed our Changing Landscape to provide useful research-based information for our many CLEAR land use outreach programs. Of course, we anticipated that others would use it too, which is why we put it up on the web. Quite a few folks are taking us up on that offer. Here’s a sampling:
- Local Planning: Landscape and landscape change information provides a unique way for a town to look at its current status and growth patterns. CL maps and data are a common component of municipal Plans of Conservation and Development.
- State Regulation: CL data on impervious surfaces was used by the CT DEEP to provide the foundation for their Impervious Cover TMDL water regulation for Eagleville Brook – the first of its kind in the nation. Similarly, CCL riparian land cover data was used by CT DEEP in the development of a statewide bacteria TMDL regulation.
- Research and Education: Faculty at UConn, Yale, Wesleyan, Trinity and other institutions of higher learning use CL information for research and/or as a teaching tool in classes related to landscape architecture, environmental studies, and geospatial science.
- State Planning and Monitoring: CL land cover data provide a key information layer for the new draft of the 2013-2018 Conservation and Development Policies Plan, currently under development by the CT Office of Policy and Management. The CT Council on Environmental Quality, a watchdog and monitoring organization created by the Legislature, uses CL land cover, forest fragmentation and agricultural lands analyses to help track CT’s environmental progress.
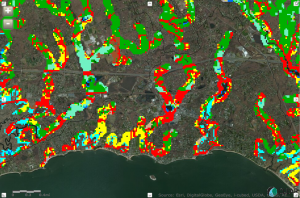
- Regional Environmental Assessment: As noted, the federal/state partnership Long Island Sound Study funded CLEAR to expand the CL to include the Westchester County and Long Island portions of the Long Island Sound watershed. The project includes basic land cover, riparian land cover (see figure) and impervious cover information, and is meant to assist LISS researchers and managers to help track progress of several elements in its Comprehensive Conservation and Management Plan.
- National data creation: The NOAA Coastal Service Center used the CL website as the model for their Coastal Land Cover Atlas, a national web tool showing land cover change in all coastal states. As part of its creation, NOAA CSC also ran the CLEAR Forest Fragmentation model on its national land cover dataset, and has made the resultant maps and data available interactively through the Atlas.
- Private sector partnerships: Placeways, Inc. incorporated the Forest Fragmentation model into its popular CommunityViz© planning software, which is used by organizations all around the world.
We hope that our new 25-year dataset will find both new and returning users, who will devise hitherto unexplored ways to make use of land cover change data. So, we may be coarse here at CLEAR (at times), but at least we’re useful!