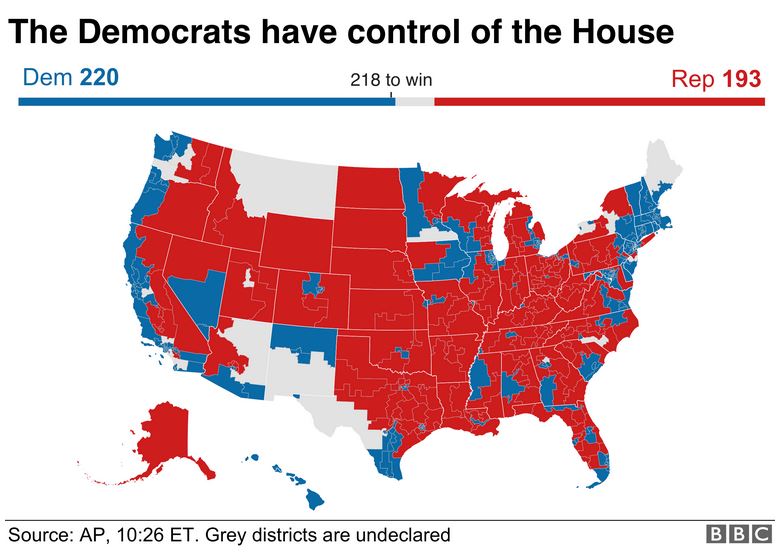
The first thing I teach someone about maps is that they are more than just lines and direction on a page, screen, or device. Maps convey information. Maps tell a story. But maps can also be deceiving. Consider for a minute, election maps. If you’re reading this blog post then you survived, if just barely, election night 2018. I bet you saw a map or two during last night’s live coverage. The familiar red and blue maps, sliced and diced by state and county lines. You can’t avoid these maps. Sometimes you also can’t look away. And yet, the standard method for showcasing our collective political conscience is flawed. Those red and blue maps don’t tell the whole story. Election night maps always give more actual space to the political right, showing more red than blue, regardless of the outcome of the vote tally. This is because they fill in areas that actually take up more physical space, but fail to take population density into account. Almost 50% of the US population inhabits just 1% of the land area which is, you guessed it, in many smaller states (or counties), concentrated along the coasts. These areas represent a large number of voters. Population density is often lost on maps showing election results. Take exhibit A below, a map meant to convey a win for Democrats. Is it just me, or do you see a whole lot of red on that map? A good map is enhanced by a title, but can stand up on its own. Not in this case, I’d argue.
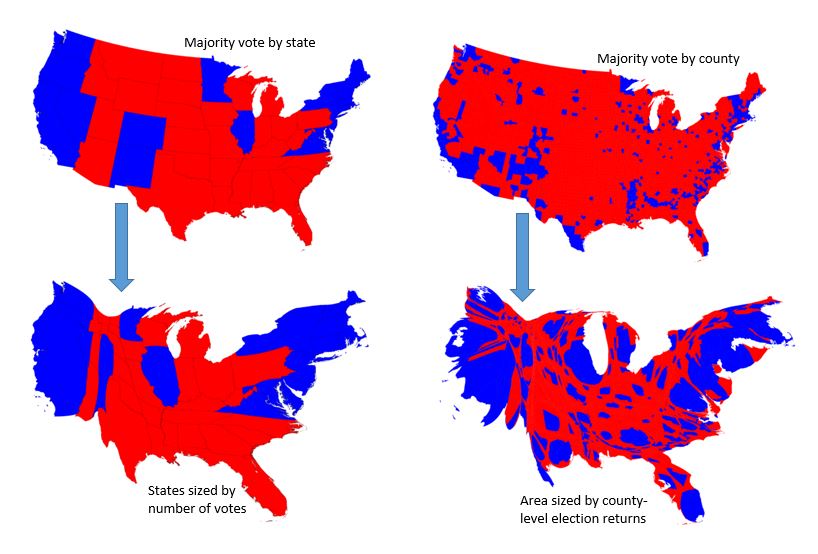
The good news is there is a way to represent population demographics and election results more accurately. Enter the cartogram – a map in which the sizes of the states are re-scaled according to the number of inhabitants rather than their acreage. Thus states with more people appear larger than states with fewer people. On such a map, the state of Connecticut (with a population of roughly 3.5 million) would appear about seven times (!) the size of Wyoming, which has a population of just over 500,000. Take a look at two cartograms developed by Mark Newman, a professor of physics at the University of Michigan. These maps show the 2016 presidential election results based on population at the state and county levels as they compare to their standard state and county level counterparts. Mark’s cartograms show a more realistic distribution of votes, where the areas of red and blue are proportional to the actual numbers of votes won by each candidate. Better maps, better information.
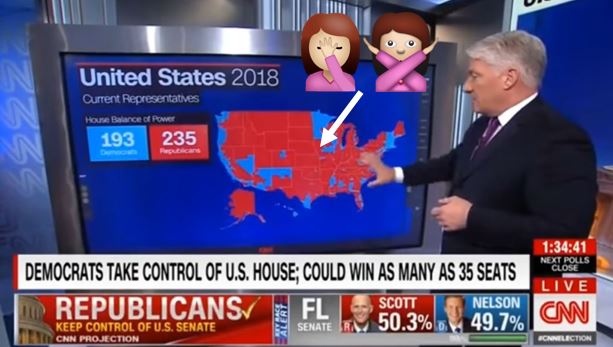
So, should you expect to see these kind of maps in 2020? Maybe. But I’m not holding my breath. It takes a lot for people to leave the comfort of a familiar map and judging by last night, we have a long way to go. Most news outlets have upgraded their live sets to include state of the art digital technology in the past few years, and this was on full display in the 2018 coverage. Maps, stats, and interactive graphics swoop in from all angles to woo audiences. And yet, despite these fireworks, I saw several examples of flawed maps at the most basic level. Mainstream media is often still getting the map projection wrong, using a Mercator projection (think Greenland too big, Africa too small) to show nationwide maps of red and blue instead of using an equal area projection. Any “map person” (or 4th grader for that matter) can tell you that a Mercator projection is great for navigating the high seas but can severely distort the relative size of features on the map, making those big red states appear quite bigger than they actually are. (Insert hand to face emoji here). Based on that alone, I’d say we have a way to go before cartograms take over the airwaves.
To learn more about Mark Newman’s very cool cartograms and view meaningful 2016 election results, visit: http://www-personal.umich.edu/~mejn/election/2016/