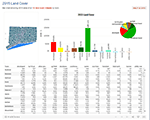
2015 Land Cover
Charts and table of 2015 land cover area by HUC 12 watershed for all 12 land cover categories.
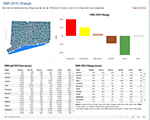
1985-2015 Overall Change
Chart and tables of 1985-2015 change by HUC 12 watershed for six major land cover categories.
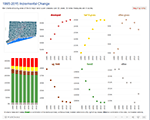
1985-2015 Incremental Change
Includes charts for six major categories for all time periods.
Download the charts from within each visualization.
Watershed Land Cover Statistics
1985 |
1990 |
1995 |
2002 |
2006 |
2010 |
2015 |
Change |
||||||||||
Class |
sq. miles | % of area | sq. miles | % of area | sq. miles | % of area | sq. miles | % of area | sq. miles | % of area | sq. miles | % of area | sq. miles | % of area | sq. miles | % of area | |
| Developed | 1031 | 17.7% | 1106 | 18.9% | 1132 | 19.4% | 1175 | 20.1% | 1197 | 20.6% | 1202 | 19.0 | 1209 | 20.7% | 178.0 | 3.1% | |
| Turf & Grass | 385 | 6.6% | 407 | 7.0% | 426 | 7.3% | 452 | 7.7% | 474 | 8.2% | 478 | 7.9 | 477 | 8.2% | 92.3 | 1.6% | |
| Other Grasses | 95 | 1.6% | 100 | 1.7% | 123 | 2.1% | 127 | 2.2% | 118 | 2.1% | 124 | 2.1 | 117 | 2.0% | 22.1 | 0.4% | |
| Agricultural Field | 474 | 8.1% | 448 | 7.7% | 434 | 7.4% | 412 | 7.0% | 403 | 6.9% | 401 | 7.4 | 400 | 6.8% | -73.6 | -1.3% | |
| Deciduous Forest | 2784 | 47.7% | 2717 | 46.5% | 2671 | 45.7% | 2628 | 45.0% | 2606 | 44.5% | 2597 | 46.1 | 2597 | 44.5% | -186.1 | -3.2% | |
| Coniferous Forest | 526 | 9.0% | 520 | 8.9% | 516 | 8.8% | 511 | 8.7% | 507 | 8.7% | 506 | 8.8 | 506 | 8.7% | -20.3 | -0.4% | |
| Water | 231 | 4.0% | 226 | 3.9% | 221 | 3.8% | 218 | 3.7% | 218 | 3.7% | 219 | 3.2 | 216 | 3.7% | -14.8 | -0.3% | |
| Non-forested Wetland | 24 | 0.4% | 25 | 0.4% | 25 | 0.4% | 26 | 0.4% | 26 | 0.4% | 25 | 0.4 | 25 | 0.4% | 0.3 | 0.0% | |
| Forested Wetland | 204 | 3.5% | 203 | 3.5% | 202 | 3.5% | 202 | 3.5% | 201 | 3.5% | 202 | 3.7 | 202 | 3.5% | -2.6 | -0.0% | |
| Tidal Wetland | 29 | 0.5% | 29 | 0.5% | 29 | 0.5% | 28 | 0.5% | 28 | 0.5% | 28 | 0.5 | 28 | 0.5% | -0.8 | -0.0% | |
| Barren Land | 37 | 0.6% | 40 | 0.7% | 42 | 0.7% | 43 | 0.7% | 44 | 0.7% | 39 | 0.6 | 43 | 0.7% | 6.3 | 0.1% | |
| Utility Corridor | 20 | 0.3% | 20 | 0.3% | 20 | 0.3% | 20 | 0.3% | 20 | 0.3% | 20 | 0.4 | 20 | 0.3% | -0.6 | -0.0% | |
For citation purposes: University of Connecticut’s Center for Land Use Education and Research. (March 04, 2022). Long Island Sound Watershed Numbers and Charts. https://clear.uconn.edu/projects/landscape/lis-stats/