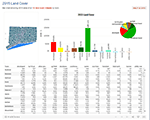
2015 Land Cover
Charts and table of 2015 land cover area by town for all 12 land cover categories.
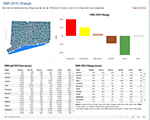
1985-2015 Overall Change
Chart and tables of 1985-2015 change by town for six major land cover categories.
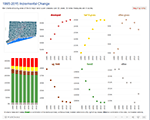
1985-2015 Incremental Change
Includes charts for six major categories for all time periods.
Download the charts from within each visualization.
State Land Cover Statistics
1985 |
1990 |
1995 |
2002 |
2006 |
2010 |
2015 |
Change |
||||||||||
Class |
sq. miles | % of state | sq. miles | % of state | sq. miles | % of state | sq. miles | % of state | sq. miles | % of state | sq. miles | % of state | sq. miles | % of state | sq. miles | % of state | |
| Developed | 796.5 | 16.0 | 861.4 | 17.3 | 884.6 | 17.8 | 922.0 | 18.6 | 941.4 | 19.0 | 946.1 | 19.0 | 951.8 | 19.2 | 155.3 | 3.1 | |
| Turf & Grass | 309.6 | 6.2 | 328.3 | 6.6 | 345.0 | 6.9 | 367.3 | 7.4 | 387.9 | 7.8 | 390.5 | 7.9 | 390.0 | 7.9 | 80.4 | 1.6 | |
| Other Grasses | 78.2 | 1.6 | 81.6 | 1.6 | 104.0 | 2.1 | 106.9 | 2.2 | 99.4 | 2.0 | 104.5 | 2.1 | 98.5 | 2.0 | 20.3 | 0.4 | |
| Agricultural Field | 435.2 | 8.8 | 412.1 | 8.3 | 398.3 | 8.0 | 376.4 | 7.6 | 367.6 | 7.4 | 366.7 | 7.4 | 365.4 | 7.4 | -69.8 | -1.4 | |
| Deciduous Forest | 2452.7 | 49.4 | 2395.4 | 48.2 | 2353.5 | 47.4 | 2318.6 | 46.7 | 2298.5 | 46.3 | 2292.0 | 46.1 | 2292.5 | 46.1 | -160.3 | -3.2 | |
| Coniferous Forest | 452.2 | 9.1 | 447.1 | 9.0 | 443.5 | 8.9 | 439.6 | 8.9 | 436.5 | 8.8 | 436.0 | 8.8 | 435.5 | 8.8 | -16.7 | -0.3 | |
| Water | 171.7 | 3.5 | 167.0 | 3.4 | 162.5 | 3.3 | 159.3 | 3.2 | 159.7 | 3.2 | 159.8 | 3.2 | 158.2 | 3.2 | -13.6 | -0.3 | |
| Non-forested Wetland | 20.9 | 0.4 | 21.5 | 0.4 | 21.5 | 0.4 | 22.1 | 0.4 | 21.6 | 0.4 | 21.1 | 0.4 | 21.2 | 0.4 | 0.3 | 0.0 | |
| Forested Wetland | 184.2 | 3.7 | 183.0 | 3.7 | 182.4 | 3.7 | 181.8 | 3.7 | 181.4 | 3.7 | 181.9 | 3.7 | 181.8 | 3.7 | -2.4 | 0.0 | |
| Tidal Wetland | 23.0 | 0.5 | 23.0 | 0.5 | 22.9 | 0.5 | 22.8 | 0.5 | 22.4 | 0.5 | 22.4 | 0.5 | 22.4 | 0.5 | -0.6 | 0.0 | |
| Barren Land | 25.1 | 0.5 | 29.4 | 0.6 | 31.7 | 0.6 | 33.2 | 0.7 | 33.7 | 0.7 | 29.0 | 0.6 | 32.7 | 0.7 | 7.6 | 0.2 | |
| Utility Corridor | 18.1 | 0.4 | 17.7 | 0.4 | 17.7 | 0.4 | 17.5 | 0.4 | 17.5 | 0.4 | 17.5 | 0.4 | 17.5 | 0.4 | -0.6 | 0.0 | |
For citation purposes: University of Connecticut’s Center for Land Use Education and Research. (March 04, 2022). CT Land Cover Numbers and Charts . https://clear.uconn.edu/projects/landscape/ct-stats/.