
CLEAR has developed the Local Watershed Assessment Tool, an online tool that uses new high resolution (1 meter) land cover to estimate the health of local watersheds at a much finer scale than has ever been possible. The project was funded by the Long Island Sound Study (LISS) and was conducted in partnership with the Connecticut Department of Energy and Environmental Protection (CT DEEP) and Footprints in the Water, LLC.
Many studies throughout the country have demonstrated that there is a close relationship between watershed health and land use. However, studies of this relationship have been limited to what can be determined using moderate resolution (30 meter) land cover data. In the past, CLEAR has evaluated watersheds using its own 30m land cover data to look at critical characteristics such as impervious cover, forest cover, and riparian (streamside) land cover; these studies were done at the USGS Hydrologic Unit Code (HUC) 12-digit watershed level, which nationally averages about 36 square miles, or about 23,000 acres per watershed.
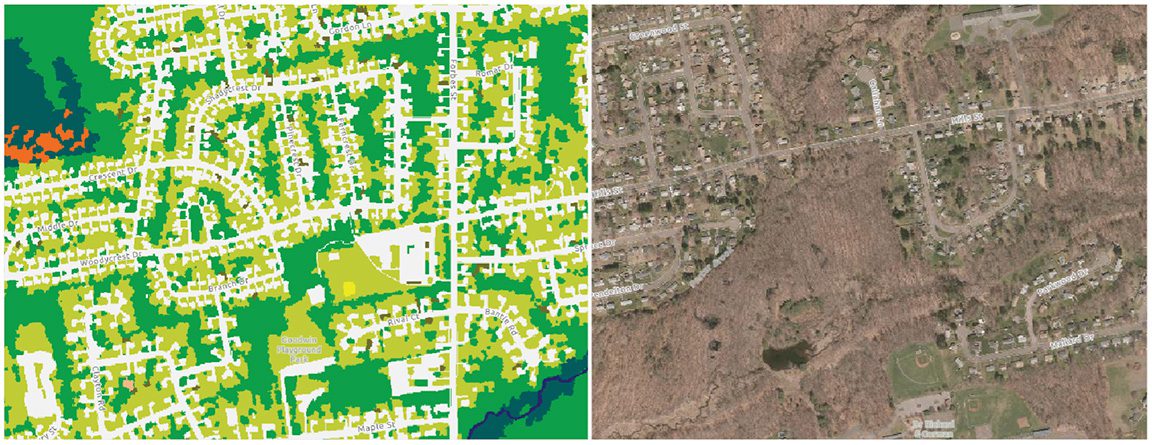
With the release of NOAA’s 1 meter land cover data for Connecticut (above image), a more targeted, localized analysis is possible. Using these data, CLEAR was able to accurately quantify land cover in much smaller watersheds. The end result is information for over 4,300 small basins across the state, averaging about 790 acres in size. The higher resolution allows for improved accuracy in determining the land cover within narrow (100-foot) riparian corridors, a critical determinant in watershed health. In addition, the 1-meter land cover has a separate impervious cover category, allowing us to directly measure impervious area rather than estimate it from models as in previous studies.
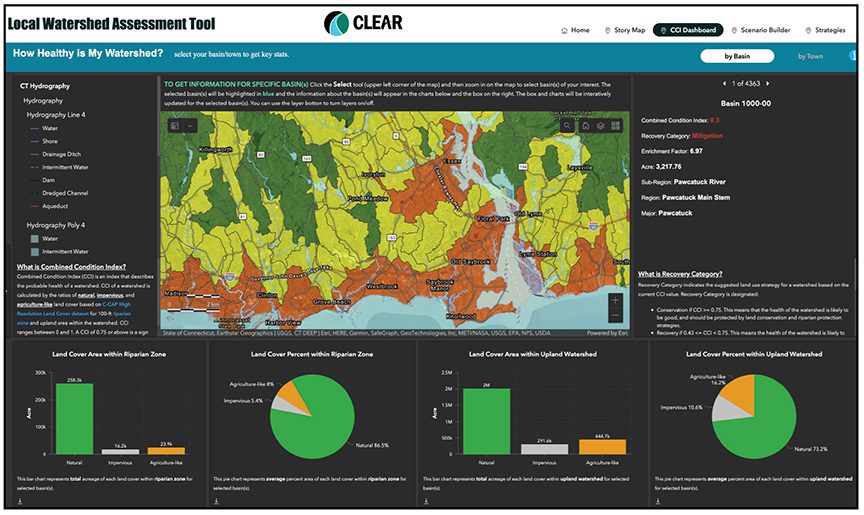
In developing the Local Watershed Assessment Tool, CLEAR used this data to analyze the land cover profiles of both the overall local basin and the 100-foot riparian zone within that basin. The combined landscape metrics were then compared with the CT DEEP network of sampling sites measuring stream bottom macroinvertebrate communities, a widely accepted method for estimating the biointegrity (health) of the drainage area upstream of the sampling site. Watershed health is then presented in the tool’s “dashboard” for each of the 4300 basins as a number called the Combined Condition Index (CCI) that ranges between 0 (worst) and 1 (best). The basins are color coded into three categories for action—Conservation, Recovery, and Mitigation—to help prioritize and guide local decisions such as riparian protection or restoration.
Nitrogen is a nutrient that is of particular concern to inland bodies of water and the Long Island Sound.
The tool dashboard also provides a nitrogen “Enrichment Factor,” or EF, for each basin. EF is an estimate of how much nitrogen is being generated by a given basin compared to the amount that would be expected from a totally forested basin. Thus, an EF of 3 would mean that the land cover profile from that basin is expected to export about three times the “pristine” (baseline) nitrogen load.
The tool also includes a “scenario builder” that allows users to see the expected changes to watershed health that result from changes to basin-wide and riparian land cover. For example, what will happen to the biointegrity (CCI) or nitrogen load if you restore more natural land in the riparian zone, and how would that effect the overall health ranking (conservation, restoration, mitigation) of that watershed? In the end, the goal is to present land cover information and its implications for watershed health at a geographic scale that will be immediately recognizable—and therefore potentially actionable—for local land use decision makers at the municipal and individual property levels.
The new Local Watershed Assessment Tool is sitting there, waiting for you to use! We encourage you to check it out. A description of the project, the data, and how to use the tool is included in the Story Map that can be reached from the home page, and there is also a video demonstration of the tool by CLEAR geospatial tool master Qian “Rachel” Lei-Parent.