What do I need to participate?
A computer with a connection to the internet (internal or external). Either a Mac or PC will work. Here are the system requirements:
On a PC
- Internet Explorer® 7.0 or newer, Mozilla® Firefox® 3.0 or newer or Google™ Chrome™ 5.0 or newer (JavaScript™ and Java™ enabled)
- Windows® 7, Vista, XP or 2003 Server
- Cable modem, DSL or better Internet connection
- Minimum of Pentium® class 1GHz CPU with 512 MB of RAM (recommended) (2 GB of RAM for Windows® Vista)
Participants wishing to connect to audio using VoIP will need a fast Internet connection and speakers. *
On a Mac®
- Safari™ 3.0 or newer, Firefox® 3.0 or newer or Google™ Chrome™ 5.0 or newer (JavaScript™ and Java™ enabled)
- Mac OS® X 10.4.11 – Tiger® or newer
- PowerPC G4/G5 or Intel processor (512 MB of RAM or better recommended)
- Cable modem, DSL, or better Internet connection
Participants wishing to connect to audio using VoIP will need a fast Internet connection and speakers.*
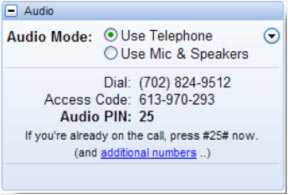
*If you don’t have speakers, you can listen to the audio using your phone. To do so:
- Dial the phone number listed in your confirmation email. OR
- Once you connect your computer to the webinar, select the audio options box on the GoToWebinar toolbox, select “telephone,” dial the number indicated, and enter the provided access code. It will look something like this:
How do I connect to the Webinar?
After you register for the webinar, you will receive a confirmation email that same day, and a reminder email the day before the webinar. At least five minutes prior to the webinar, use either of these methods for connecting:
Option 1: To join a Webinar from a confirmation or reminder email
- Open the confirmation or reminder email for the Webinar event.
- Click the link provided in the email to join the Webinar.
- If prompted, click Yes, Trust or Always to accept the download. If the automatic download does not occur, follow the instructions on the download Web page to do it manually.
- If prompted, enter the Webinar password. If a password is required, this would have been provided in a separate communication from the Webinar organizer.
You will be entered into the Waiting Room. The Attendee Control Panel and GoToWebinar Viewer Window will appear when the organizer starts the Webinar.
Option 2: To join a Webinar from the GoToWebinar Website
- Open an Internet browser and go to www.gotowebinar.com. Click Join a Webinar at the top of the page.
Or you can go to www.joingotowebinar.com. - On the Join the Webinar window, enter the Webinar ID you received from your Webinar organizer (see your confirmation or reminder email).
- If prompted, complete the Registration form.
- If prompted, click Yes, Trust or Always to accept the download. If the automatic download does not occur, follow the instructions on the download Web page to do it manually.
- If prompted, enter the Webinar password. If a password is required, this would have been provided in a separate communication from the Webinar organizer.You will be entered into the Waiting Room. The Attendee Control Panel and GoToWebinar Viewer Window will appear when the organizer starts the Webinar.
Depending on your computer and internet speed, it typically takes 1 - 5 minutes to connect your computer to the webinar. It is perfectly normal to not see anything for a few minutes before the welcome screen opens.
If after 5 minutes you still are not connected, call 860-345-4511 or email clear@uconn.edu.
I registered but did not receive a confirmation. What do I do?
You should receive a confirmation within an hour of completing your registration. If you do not, it is possible that either there was a typo when you entered your email OR the email was blocked by a spam blocker or firewall. Here are 3 things you can do to correct this:
- Check your SPAM/Junk Folder: It is possible that the email was diverted to your SPAM/Junk folder instead of your inbox. Check that first. The email would have come from “UConn CLEAR” under the “GoToWebinar.Notifications@citrixonline.com” email address with a subject line of “Confirmation: UConn CLEAR Webinar . . .”
- Talk to your IT folks: Your IT folks hold the key to which emails are allowed in. Ask them if they can allow messages from GoToWebinar.Notifications@citrixonline.com to come through the firewall.
- Contact Us: If all else fails email us at clear@uconn.edu.
What do I need to participate?
A computer with a connection to the internet (internal or external). Either a Mac or PC will work. Here are the system requirements:
On a PC
- Internet Explorer® 7.0 or newer, Mozilla® Firefox® 3.0 or newer or Google™ Chrome™ 5.0 or newer (JavaScript™ and Java™ enabled)
- Windows® 7, Vista, XP or 2003 Server
- Cable modem, DSL or better Internet connection
- Minimum of Pentium® class 1GHz CPU with 512 MB of RAM (recommended) (2 GB of RAM for Windows® Vista)
Participants wishing to connect to audio using VoIP will need a fast Internet connection and speakers. *
On a Mac®
- Safari™ 3.0 or newer, Firefox® 3.0 or newer or Google™ Chrome™ 5.0 or newer (JavaScript™ and Java™ enabled)
- Mac OS® X 10.4.11 – Tiger® or newer
- PowerPC G4/G5 or Intel processor (512 MB of RAM or better recommended)
- Cable modem, DSL, or better Internet connection
Participants wishing to connect to audio using VoIP will need a fast Internet connection and speakers.*
*If you don’t have speakers, you can listen to the audio using your phone. To do so:
- Dial the phone number listed in your confirmation email. OR
- Once you connect your computer to the webinar, select the audio options box on the GoToWebinar toolbox, select “telephone,” dial the number indicated, and enter the provided access code. It will look something like this:
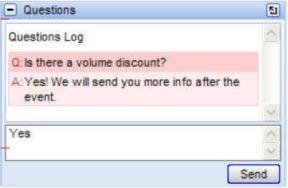
Can I ask questions during the presentation?
YES! We welcome questions. Just type your question into the Question box on your GoToWebinar toolbar. It will look something like this:
I have connected to the presentation, but the audio doesn’t seem to quite match what is on my screen. What’s going on?
Page load times will vary based on internet speed, the processing power of your computer, and other factors. As such, sometimes the audio is slightly off from the visual. We do monitor load times during the webinar and wait for the visuals to catch up when necessary. For those of you with fast connections this may mean some slightly awkward pauses from time to time. In either case, please stay with us.
Will the webinar be available online?
Yes. Assuming all goes well, the webinars will be recorded. It usually takes us 2-3 days to process the video and post them on our website. Visit our Webinar Library.
Can I ask questions during the presentation?
YES! We welcome questions. Just type your question into the Question box on your GoToWebinar toolbar. It will look something like this: